Gallons per 100 Miles — The Calibration Chart
In the US, automobile fuel economy is usually measured in miles per gallon, mpg. This works, but there is a better metric, especially for comparison between values. Gallons per 100 miles is the way to go!
This is very well known, and even I’ve talked about this before. There are numerous online tools to do the conversion from mpg to gallons per 100 miles… but there don’t appear to be any simple conversion or calibration charts for it.
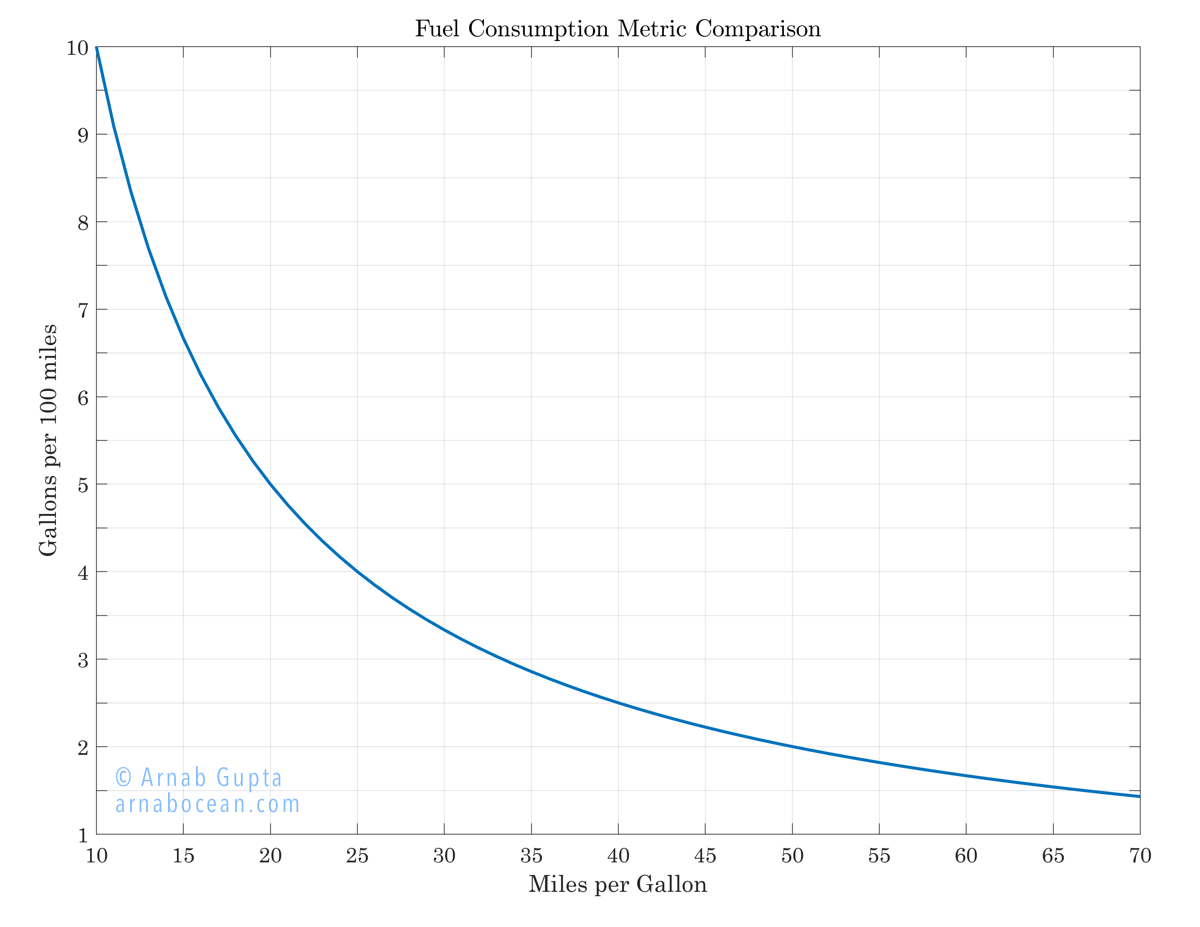
Well, here you are — an easy to use chart to convert between mpg and gallons per 100 miles (or, equivalently, from km/l to liters per 100km).
What’s wrong with using miles per gallon, though? Well, there’s nothing wrong with using it, of course (we all use it, after all!). It’s that it’s just not a good metric when it comes to comparisons.
This is because the mpg metric is not linear. This means that even a consistent difference in mpg, say a “10 mpg difference”, means different things based on where the difference is calculated from. This makes it very hard to calculate and compare the benefits of better fuel efficiency!
Let’s take a couple of examples and use the chart below. Let’s say you’re planning to shift from owning a 15mpg vehicle to owning a 25mpg vehicle. What are your fuel savings? On the other hand, say you’re shifting from a 25mpg vehicle to a 35mpg vehicle. What about now?

Gallons per 100 miles Conversion (Download full size here)
Let’s look at the chart. The horizontal axis shows miles per gallon, as indicated. The vertical axis shows gallons per 100 miles, also as indicated. Let’s find approximate numbers for our cases above:
- 15mpg → ≈ 6.7 gallons per 100 miles
- 25mpg → 4 gallons per 100 miles
- 35mpg → ≈ 2.8 gallons per 100 miles
For every 100 miles you drive, a “10mpg improvement” from 15mpg saves you 2.5 gallons (≈ 40%) of fuel. On the other hand, over the same 100 miles and the same “10mpg improvement”, but from 25mpg, you save only 1.2 gallons (≈ 30%) of fuel. See how these numbers are different, even though the mpg metric difference between the two cases remains constant?
The mpg metric would have worked, if our baseline was different. But does anyone ever say: “Hey, I have 3 gallons of fuel; how far can I go with it?” Instead, our question is always: “I need to drive 500miles; how much fuel would I need?”
Go ahead and download the full size chart and keep with you. If you’re in the market for cars, this will come in handy! You know how much you drive; this chart gives you an easy way to measure your particular fuel requirements (or savings).
P.S.: The above chart works with any ratio of units; just keep the units the same between the horizontal and vertical axes. So, for example, the same chart applies for km/l vs. liters per 100km.